Codecaver
07. February 2026 · 5 min read
While studying for OffSec’s EXP-301 (OSED) course back in 2022, I found myself in a situation that required me to locate so-called code caves in a binary.
What are code caves?
There are several ways to bypass Data Execution Prevention (DEP) on Windows. Two common ones are using VirtualAlloc/VirtualProtect or using WriteProcessMemory.
The former is usually used to change the memory protection settings of the memory page(s) where the shellcode resides.
E.g. when placed on the stack to change it from PAGE_READWRITE to PAGE_EXECUTE_READWRITE to make that stack region executable. Afterwards, the execution flow can be redirected to the stack and the shellcode can be executed.
On the other hand, WriteProcessMemory (WPM) can be used to copy data from one location to another. This means we can move our shellcode from the stack to an executable memory region like the .text section of a DLL or the executable itself. While the text-sections are not writable, WPM actually gives us a hand with that by working the following way:
- Make the destination writable
- Copy the data from the source to the destination
- Restore the original memory protection constants
The only problem is that if we overwrite code in that section and the process tries to execute it later on, it will most definitely crash the application. To avoid crashing it, exploit developers commonly use so-called code caves which are most of the time, just padded areas in those sections. Those paddings exist due to things like page-alignment or certain compiler optimizations.
In total there are three types of paddings we can look for:
- NULL bytes (0x00)
- INT3 interrupt bytes (0xCC)
- NOPs (0x90)
We can assume byte sequences of multiple NULL-/INT3-/NOP-bytes won’t be executed by the process under normal circumstances. Because of that those locations represent a great destination for our shellcode as they are executable and won’t interfere with the execution flow.
The Code Caver Extension
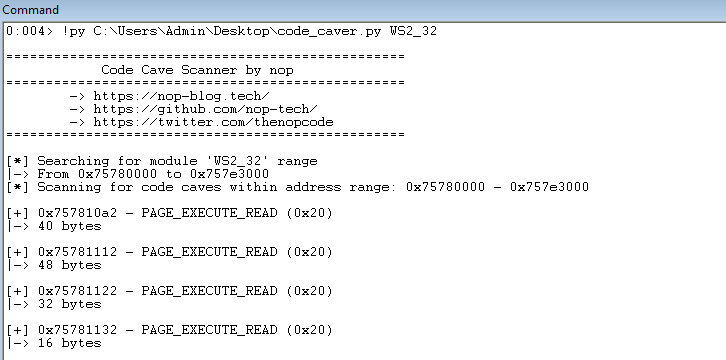
Back then I wrote some very questionable Python code (code_caver) that you could execute within WinDbg using pykd. Now there were some problems with that solution:
- My code quality was very questionable
- You had to install pykd and load the
pykd.dllfile into WinDbg - Python is rather slow
The tl;dr of getting code_caver.py to work was:
- Place
pykd.dllinC:\Program Files\Windows Kits\10\Debuggers\x86\winext - Install the pykd package via pip
- Load pykd inside WinDbg with
.load pykd - Execute code_caver with
!py C:\Path\to\file\code_caver.py <MODULE NAME>
I’ve demonstrated the old code caver as well as the workflow in a YouTube video I created for GuidedHacking:
To solve (some of) those problems and the tedious setup process I went back to my code caver script and rewrote it entirely as a native DLL for WinDbg. No more pykd, no more Python, … however still questionable code quality I’m afraid.
The new version of code caver is written in native C++ and uses the DbgEng and Wdbgexts header files to work directly inside WinDbg without the need of further third-party
software like pykd.
It’s written in a way so that it supports both x64 and x86 compilation. The resulting DLL files can be loaded in the x64 and x86 versions of WinDbg(X) respectively.
After loading it with .load C:\Path\to\dll\codecaver.dll you can use the extension the following way to find caves:
 10:000> !cave
 2Usage: !cave <module_name> [min_size]
 3Example: !cave kernel32 0x10
 4
 50:000> !cave ch 0x10
 6
 7Found 5 code cave(s):
 8
 9START ADDRESS       END ADDRESS         SIZE        PATTERN     PROTECTION
10------------------  ------------------  ----------  ----------  -------------------------
110x00007ff7a62e2b56  0x00007ff7a62e2b65  0x10        INT3        PAGE_EXECUTE_READ
120x00007ff7a62e50a5  0x00007ff7a62e50b5  0x11        INT3        PAGE_EXECUTE_READ
130x00007ff7a62fc136  0x00007ff7a62fc145  0x10        INT3        PAGE_EXECUTE_READ
140x00007ff7a62fc791  0x00007ff7a62fc7a5  0x15        INT3        PAGE_EXECUTE_READ
150x00007ff7a62fd6f6  0x00007ff7a62fdfff  0x90a       PADDING     PAGE_EXECUTE_READ
If no minimum size threshold is provided, a default threshold of 0x40 bytes (64) will be assumed.
To get a more detailed help message within WinDbg you can use !cave -h to print codecaver’s help message.
Tip: For WinDbgX place the DLL in C:\Program Files\WindowsApps\Microsoft.WinDbg_<Version>\<Arch>\winext to load it with just .load codecaver.
You can obtain the WinDbg package version / the installation path of it with the following PowerShell command:
1(Get-AppxPackage Microsoft.WinDbg).InstallLocation
For WinDbg Legacy the plugin folder is in C:\Program Files\Windows\Kits\10\Debuggers\<Arch>\winext.
Technical Details
On load DebugExtensionInitialize creates an IDebugClient via DebugCreate and queries it for IDebugControl to obtain the WinDbg extension APIs.
When using the !cave command, the DLL queries IDebugSymbols3::GetModuleByModuleName to resolve the requested module’s base address and then reads the IMAGE_DOS_HEADER and IMAGE_NT_HEADERS headers.
The code then walks the module’s address range on a per-page basis (0x1000 bytes at a time).
For each page IDebugDataSpaces2::QueryVirtual is used to retrieve MEMORY_BASIC_INFORMATION64 for that address and thereby obtain the memory protection constants. If the constants do not include the executable bit, the entire non-executable region is skipped for optimization reasons.
On the other hand, if the page is executable the contents are read via IDebugDataSpaces2::ReadVirtual and scanned byte-by-byte.
During that process, the scanner tracks whether it’s currently inside a cave using a simple state machine: when it hits a cave byte (0x90, 0xCC, or 0x00) it begins tracking a new cave; when it encounters a different cave byte pattern, a non-cave byte, a page boundary with different memory protection, or non-executable/unreadable memory, it ends the current cave and saves it (if it meets the minimum size threshold).
This means one contiguous byte sequence can produce two separate cave entries if the protection differs.
Both the source code and pre-compiled files can be found here:
